How to Build a Trade Finance Dashboard for Board Reporting
Trade finance sits at the intersection of operational complexity and financial risk, making it one of the most challenging areas for meaningful board reporting. While treasury dashboards have evolved
How to Build a Trade Finance Dashboard for Board Reporting
Trade finance sits at the intersection of operational complexity and financial risk, making it one of the most challenging areas for meaningful board reporting. While treasury dashboards have evolved significantly over the past decade, trade finance remains stuck in spreadsheet hell—a problem that becomes acute when boards need to understand exposure, working capital efficiency, and operational risk across multiple jurisdictions and currencies.
The challenge isn't just technical. Trade finance involves documentary credits, guarantees, supply chain finance, and receivables management—each with different risk profiles, regulatory requirements, and performance metrics. Building an effective trade finance dashboard requires understanding both the underlying business processes and the specific information needs of board-level decision makers.
This guide examines how to construct a trade finance dashboard that serves board reporting requirements while maintaining the operational detail needed for day-to-day management.
Understanding Board-Level Trade Finance Requirements
Board members typically care about four key areas when reviewing trade finance: risk concentration, working capital efficiency, regulatory compliance, and strategic performance indicators. These requirements differ significantly from operational dashboards used by trade finance teams.
Risk concentration analysis requires visibility into counterparty exposure, geographic concentration, and product mix. Unlike traditional credit risk reporting, trade finance risk is often secured by underlying commodities or documentary arrangements, creating a more complex risk picture. Effective dashboards need to show not just exposure amounts, but the quality of underlying security and the operational status of transactions.
Working capital metrics in trade finance extend beyond simple DSO calculations. Payment terms, documentary requirements, and financing costs create a web of interconnected metrics that affect cash flow timing. The dashboard must show how trade finance decisions impact overall working capital, including the cost of different financing structures and their effect on cash conversion cycles.
Regulatory compliance reporting has become increasingly complex as jurisdictions implement new trade finance regulations. Sanctions screening, know-your-customer requirements, and anti-money laundering controls all generate metrics that boards need to monitor. The key is presenting compliance status without overwhelming non-specialist directors with operational detail.
Strategic performance indicators focus on how trade finance supports broader business objectives. This includes market penetration metrics, customer relationship development through trade finance services, and the competitive positioning that different financing structures provide.
Essential Metrics and KPIs for Trade Finance Dashboards
The foundation of effective board reporting lies in selecting metrics that balance comprehensiveness with clarity. Trade finance dashboards require a carefully curated set of KPIs that speak to both financial performance and operational efficiency.
Exposure metrics form the core of most trade finance dashboards. Total committed facilities, utilization rates, and concentration limits provide the fundamental risk picture. However, static exposure numbers miss the dynamic nature of trade finance. Boards need to see pipeline data, seasonal trends, and the relationship between exposure growth and revenue generation.
Performance metrics should include margin analysis by product type, customer profitability including risk-adjusted returns, and competitive positioning data. Many organizations struggle with accurate margin calculation in trade finance because costs are spread across multiple departments and include hidden operational expenses. Effective dashboards allocate these costs appropriately and show margin trends over time.
Operational efficiency metrics capture the effectiveness of trade finance processes. Document processing times, error rates, and straight-through processing percentages all impact profitability and customer satisfaction. These operational metrics often predict future financial performance better than historical financial data.
Credit quality indicators require special attention in trade finance because traditional credit metrics may not capture the full risk picture. The dashboard should include early warning indicators specific to trade finance, such as documentary compliance trends, shipping delays, and changes in underlying commodity prices.
Cash flow metrics need to reflect the unique timing characteristics of trade finance. Simple receivables aging doesn't capture the impact of documentary requirements, shipping schedules, and payment term negotiations. Advanced dashboards show cash flow forecasting that incorporates these trade-specific factors.
Technical Architecture and Data Integration
Building a robust trade finance dashboard requires integration across multiple systems, each with different data structures and update frequencies. The technical architecture must handle everything from real-time transaction monitoring to monthly regulatory reporting.
Core banking systems typically hold the financial data, but trade finance documentation often lives in separate document management systems. Letter of credit details, shipping documents, and compliance records may be scattered across multiple platforms. The dashboard architecture must unify these data sources while maintaining data integrity and audit trails.
Real-time data requirements vary significantly across different metrics. Exposure monitoring may require near real-time updates, while performance analysis can work with daily or weekly data refreshes. The architecture should optimize data flow based on business requirements rather than technical convenience.
Modern trade finance platforms like finPhlo address integration challenges through API-first architecture and standardized data models. This approach reduces the technical complexity of dashboard development while ensuring that underlying data remains accessible for detailed analysis.
External data integration becomes critical for comprehensive trade finance dashboards. Currency rates, commodity prices, country risk ratings, and sanctions lists all impact trade finance performance. The dashboard architecture must handle these external feeds reliably while managing data quality and update frequencies.
Data governance in trade finance faces unique challenges due to regulatory requirements and cross-border data flows. The dashboard architecture must support appropriate access controls while maintaining audit trails that satisfy multiple regulatory jurisdictions.
Building Interactive Visualizations That Work
Trade finance data presents unique visualization challenges. Traditional financial charts often fail to capture the multi-dimensional nature of trade finance transactions, which involve time, geography, counterparties, commodities, and currencies simultaneously.
Geographic visualization becomes essential when dealing with global trade flows. Heat maps showing exposure concentration, trade route analysis, and country risk overlays provide insights that traditional charts cannot deliver. However, geographic visualization must be balanced with other analytical dimensions to avoid oversimplifying complex relationships.
Time-series analysis in trade finance requires careful consideration of seasonal patterns, document processing cycles, and market timing effects. Dashboard visualizations should allow users to adjust time horizons and compare different seasonal periods to identify meaningful trends.
Drill-down capabilities are crucial for board-level dashboards that need to support both high-level oversight and detailed investigation. Board members should be able to move from summary risk metrics to specific transaction details without losing context or requiring separate systems.
Interactive filtering allows dashboard users to explore different scenarios and answer ad hoc questions during board meetings. The filtering system should support complex queries across multiple dimensions while maintaining performance with large datasets.
Alert systems require careful calibration in trade finance because false positives can desensitize users to genuine risks. Effective dashboards use tiered alerting systems that distinguish between operational issues requiring immediate attention and strategic trends that need board-level discussion.
Automated Reporting and Alert Systems
Automation in trade finance reporting must balance the need for timely information with the complexity of trade finance processes. Unlike other areas of financial services, trade finance automation must account for document-driven processes and manual interventions that can affect timing and risk profiles.
Exception reporting becomes particularly important in trade finance because exceptions often indicate either operational problems or changing risk conditions. Automated systems should identify discrepancies in documentation, unusual transaction patterns, and deviations from standard processing timelines.
Regulatory reporting automation requires deep understanding of different jurisdictional requirements and their interaction with trade finance products. Automated systems must handle complex classification requirements while maintaining flexibility for manual override when necessary.
Performance reporting automation should include trend analysis and predictive indicators that help boards anticipate future performance. This includes pipeline analysis, seasonal adjustments, and early warning indicators based on operational metrics.
Risk monitoring automation must account for the dynamic nature of trade finance transactions. Automated systems should track changes in underlying commodity prices, shipping schedules, and counterparty credit ratings that could affect transaction risk profiles.
finPhlo's approach to automation focuses on working capital optimization through automated credit management and streamlined reporting processes. This reduces DSO while providing the data transparency needed for effective board reporting. The platform's automation capabilities ensure that boards receive timely, accurate information without overwhelming operational teams with reporting requirements.
Best Practices and Common Pitfalls
Successful trade finance dashboards require ongoing attention to data quality, user experience, and business alignment. The most common failure mode is building technically impressive dashboards that don't address real business needs.
Data quality issues plague many trade finance dashboards because source systems often contain incomplete or inconsistent information. Effective dashboards include data quality monitoring and provide clear indicators when information may be unreliable. This transparency builds user confidence and prevents decision-making based on flawed data.
User adoption challenges arise when dashboards are designed by technical teams without sufficient input from actual users. Board-level dashboards need to balance comprehensiveness with usability, providing sophisticated analysis capabilities without requiring extensive training.
Maintenance overhead can quickly overwhelm dashboard initiatives if not properly planned. Trade finance products and processes evolve continuously, requiring dashboard updates that maintain compatibility with existing workflows while incorporating new requirements.
Performance optimization becomes critical as data volumes grow and user expectations increase. Dashboard architecture should anticipate scaling requirements and provide acceptable response times even with complex queries across large datasets.
Change management often receives insufficient attention during dashboard implementation. Successful deployments include comprehensive user training, clear governance processes, and mechanisms for collecting and incorporating user feedback.
Security considerations require special attention in trade finance due to the sensitive nature of customer information and regulatory requirements. Dashboard access controls should align with business responsibilities while maintaining audit trails that satisfy compliance requirements.
If you're evaluating trade finance technology solutions, finPhlo offers an integrated approach that combines operational efficiency with comprehensive reporting capabilities. The platform addresses many of the technical and business challenges discussed here while maintaining the flexibility needed for diverse business requirements. Worth exploring at finphlo.com for organizations serious about modernizing their trade finance operations.
Measuring Success and ROI
Evaluating dashboard effectiveness requires metrics that go beyond technical performance indicators. Successful trade finance dashboards should demonstrate measurable business impact across multiple dimensions.
Decision-making speed often improves dramatically with effective dashboards. Organizations should measure the time required for board-level decisions related to credit approvals, limit adjustments, and strategic planning. Faster decision-making can translate directly into competitive advantages and improved customer satisfaction.
Risk management effectiveness can be measured through early identification of problem accounts, reduced credit losses, and improved regulatory compliance scores. The dashboard should enable proactive risk management rather than reactive problem-solving.
Operational efficiency improvements typically manifest as reduced manual reporting effort, faster month-end processes, and improved data accuracy. These efficiency gains often provide the clearest ROI justification for dashboard investments.
Strategic planning capabilities improve when boards have access to comprehensive, timely information about trade finance performance. Organizations should track improvements in strategic planning quality and implementation speed.
Cost reduction opportunities become visible through better visibility into process inefficiencies, duplicate efforts, and optimization opportunities. Effective dashboards often reveal cost reduction possibilities that weren't apparent through traditional reporting methods.
Frequently Asked Questions
What are the key differences between operational and board-level trade finance dashboards?
Operational dashboards focus on transaction processing, document status, and day-to-day workflow management. Board-level dashboards emphasize risk aggregation, strategic performance indicators, and working capital efficiency. Board dashboards require higher-level KPIs with drill-down capabilities, while operational dashboards prioritize real-time transaction detail and process monitoring.
How do you handle data quality issues when building trade finance dashboards?
Data quality in trade finance requires a multi-layered approach including automated validation rules, exception reporting, and clear data lineage documentation. Implement standardized data entry processes, regular reconciliation procedures, and quality scoring systems that flag potentially unreliable data. Most importantly, make data quality issues visible to users so they can make informed decisions about data reliability.
What external data sources are essential for comprehensive trade finance reporting?
Critical external data includes real-time currency exchange rates, commodity price feeds, country risk ratings, sanctions lists, and regulatory updates. Many organizations also integrate shipping and logistics data, credit rating updates, and economic indicators. The specific external data requirements depend on your product mix and geographic coverage, but currency and sanctions data are universally essential.
How can automation improve trade finance dashboard accuracy and timeliness?
Automation reduces manual data entry errors, ensures consistent data processing, and enables real-time reporting capabilities. Key automation opportunities include regulatory report generation, exception monitoring, performance calculation, and alert systems. However, automation must be carefully designed to accommodate the document-driven nature of trade finance and the need for manual intervention in complex cases.
What are the most important KPIs for board-level trade finance oversight?
Essential board-level KPIs include portfolio exposure concentration, risk-adjusted return on capital, working capital efficiency metrics, regulatory compliance scores, and customer relationship profitability. Geographic and product diversification metrics are also crucial, along with pipeline indicators that predict future performance. The specific KPIs should align with your organization's strategic objectives and risk appetite.
How do you ensure trade finance dashboards remain secure while providing necessary access?
Security requires role-based access controls aligned with business responsibilities, comprehensive audit logging, and data encryption both in transit and at rest. Implement multi-factor authentication for sensitive data access, regular access reviews, and geographic access restrictions where appropriate. Consider data masking for non-essential users and ensure compliance with cross-border data protection regulations relevant to your operating jurisdictions.
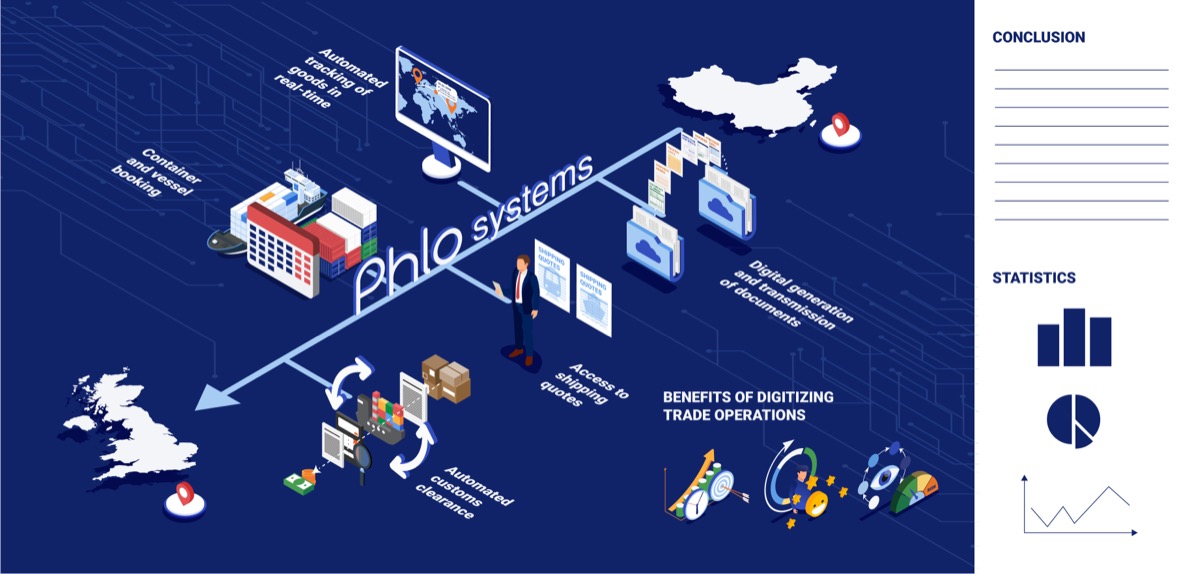
Want to learn more about Phlo Systems?
See how our platform digitises international trade for commodity traders, importers, and exporters.
Get Started